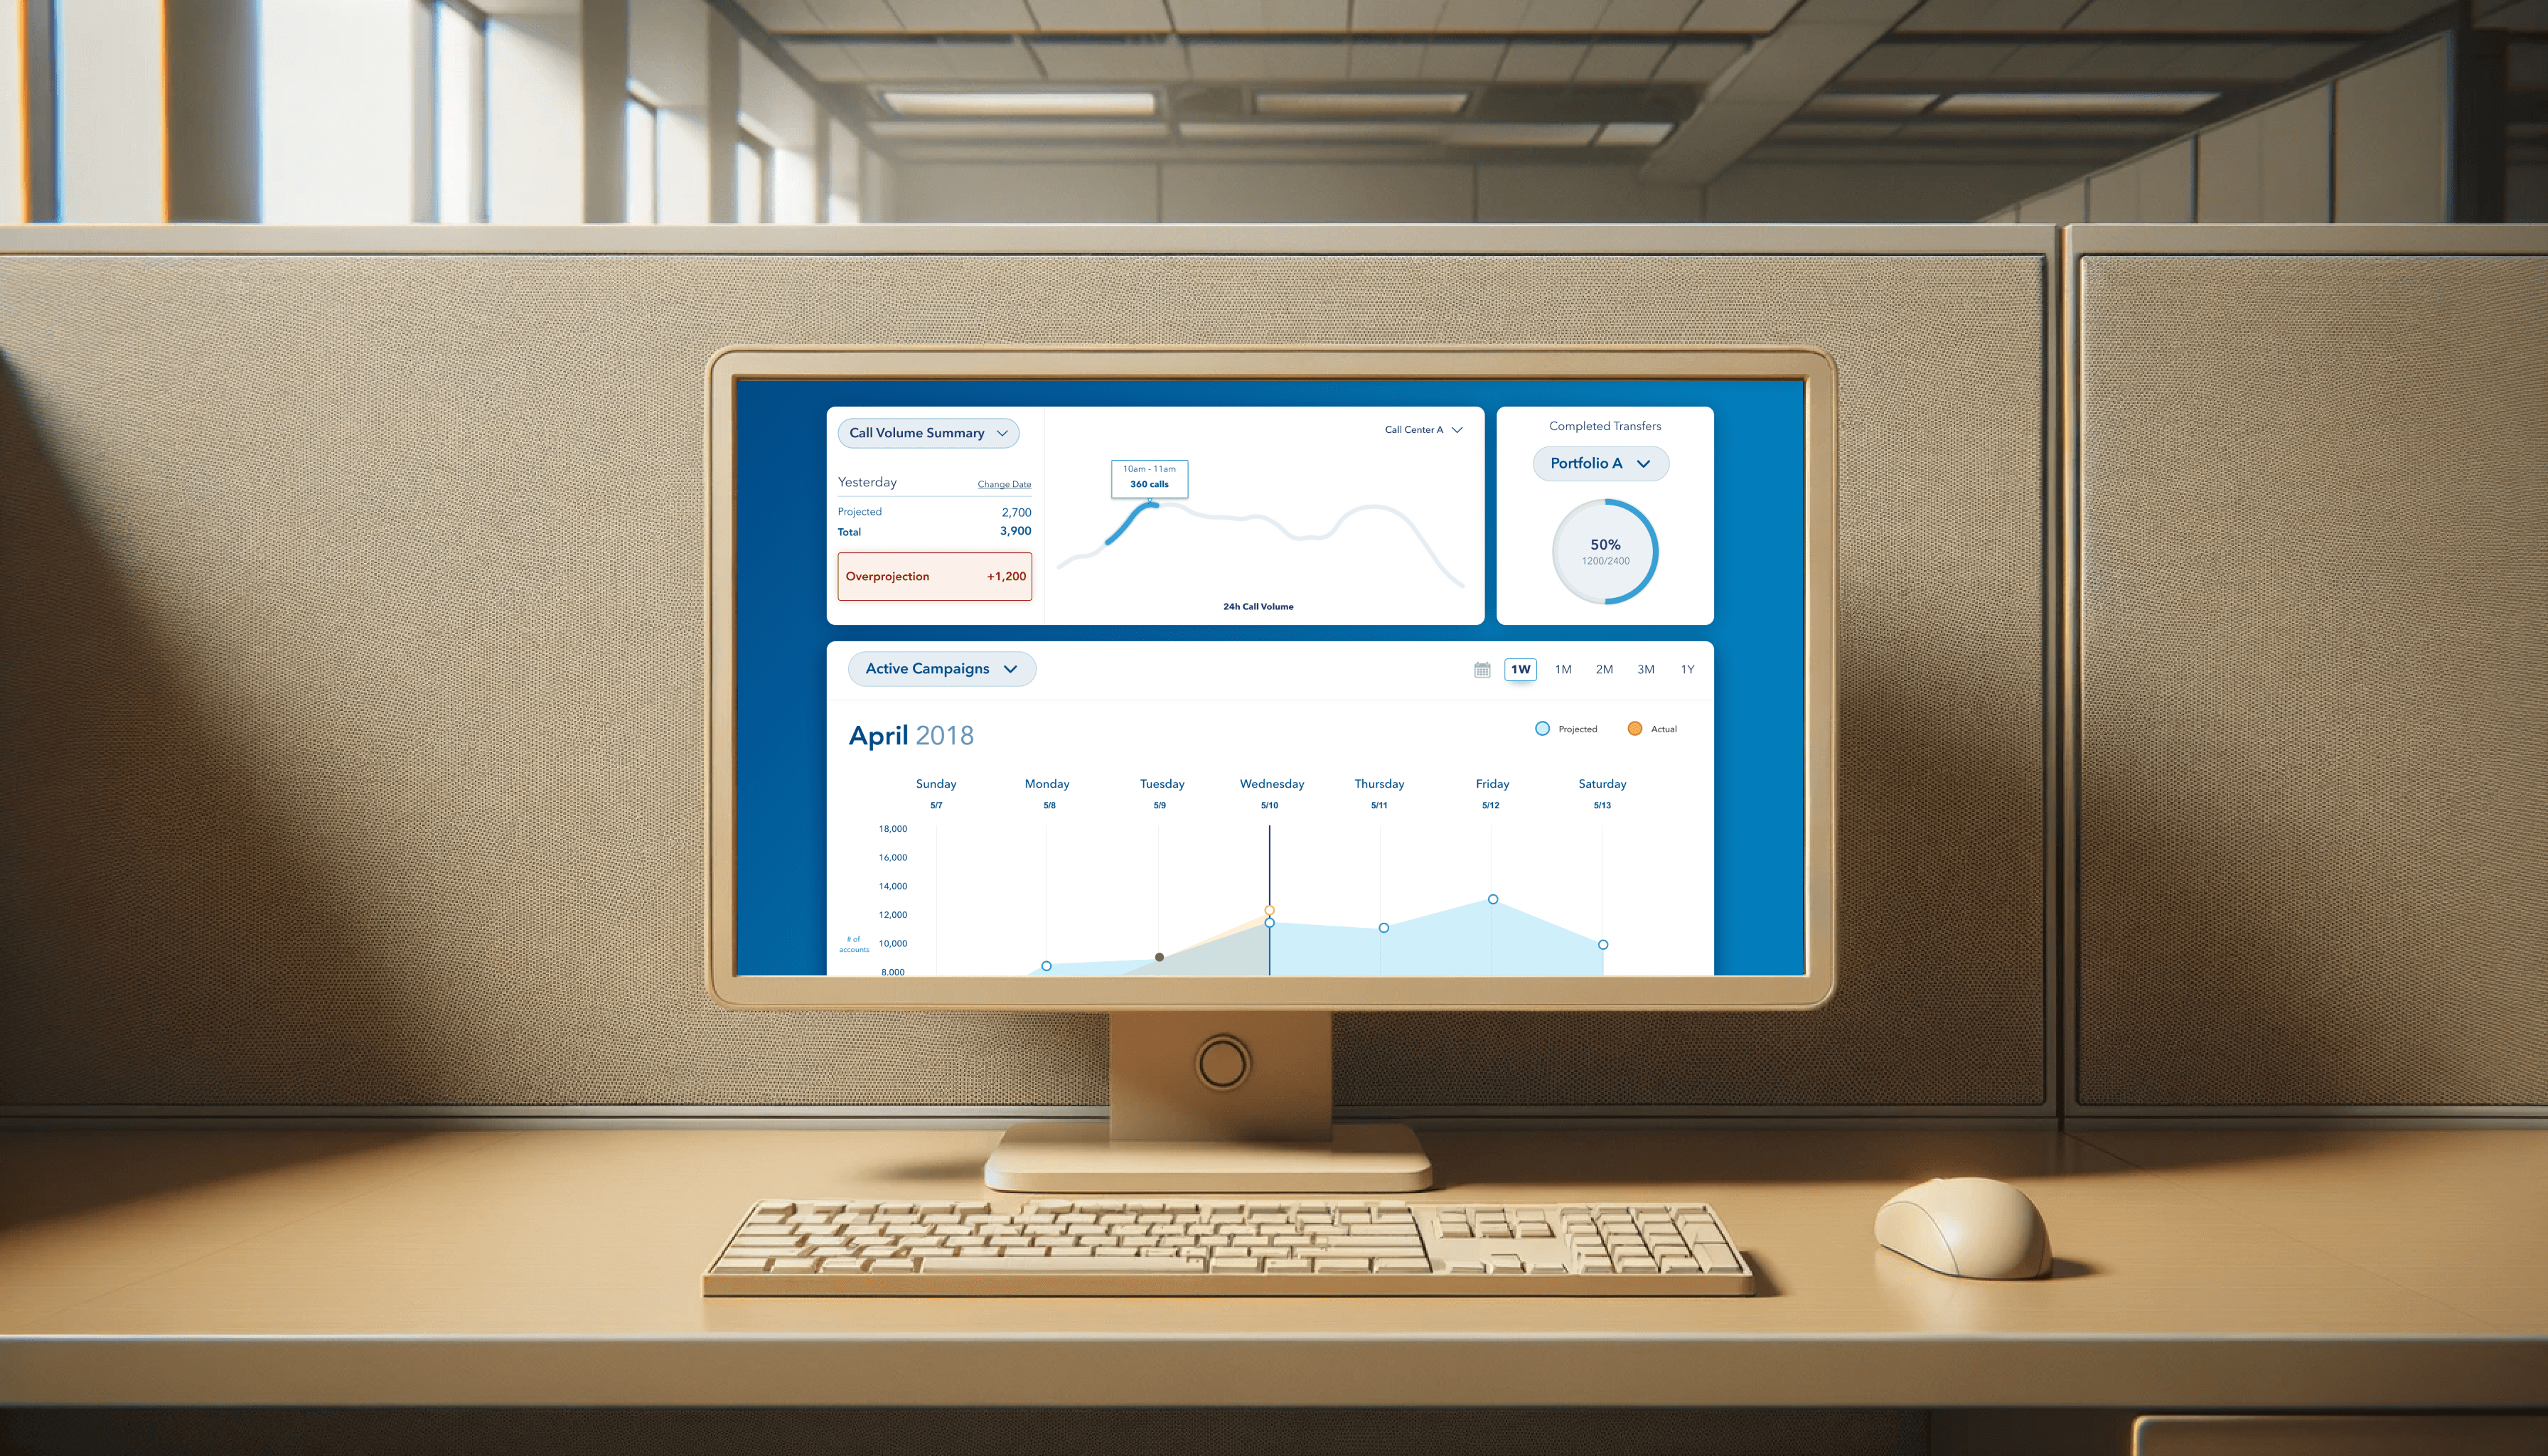
I worked as the Lead UX designer on a team of 12 inside of a Fortune 50 bank's Credit Services division. I interviewed users, synthesized qualitative data, defined problems, and ended up designing an interface to address the problems we found. In design thinking terms, I empathized, defined, ideated, prototyped, & tested. A lot.
The Credit Services division in this bank was responsible for helping large companies (American Airlines, Shell, etc) issue their own credit cards. My job was to help the executives of this division make better data-informed decisions by allowing them to interact with the data they were collecting.

The problem was their Digital Transformation. Executives bit down hard on "Big Data" but didn’t have the foresight that making data useful is the purpose of collecting it. Additionally, they stored all that sweet sweet data in a tangle of isolated databases. Myself and several Red Hat engineers were brought in to solve these problems.
While the engineers set out to solve the data consolidation problem, I set out to make a human-centered product backed by that consolidated data.

I mapped out the division's employee hierarchy (‘real’ & political) and started interviewing all users, key stakeholders, & subject matter experts. Themes started to emerge.
01 Communication Breakdown
The Credit Services division in this bank was responsible for helping large companies (American Airlines, Shell, etc) issue their own credit cards. My job was to help the executives of this division make better data-informed decisions by allowing them to interact with the data they were collecting.
02 Shipping the Dysfunctional Org Chart
The political schisms defined everything and the poor, neglected IT department was caught in the middle. They built AND maintained numerous single purpose applications for middle-managers and small teams across Marketing & Operations. None of these apps talked to each other.
03 The Holy Spreadsheet
Every executive made big decisions daily that rippled throughout the division. Staffing decisions, materials decisions, marketing campaign decisions, etc. When we arrived, the majority of data they were using lived on a master spreadsheet. That spreadsheet was being hot potato-ed between teams via email with multiple maintainers... No source of truth.
“Right now I have no idea where things are at in a campaign without talking to somebody else and waiting for them to get back to me. Operations makes me jump through so many hoops to get anything done... I avoid it.“
VP, Marketing
I live in my email. I live in Outlook. I would miss one of the... thousands... literally... of emails I get on a day to day basis. Operations doesn't exactly make it easy for us to do our job.
EVP, Marketing
Let me find you an example spreadsheet, okay, oh okay this is perfect...pauses .....hmm... *sighs* out of date... let me email Paula to get the updated one. I must have missed a meeting.
Director, Operations
Honestly...we need help; right now we are overstaffing or understaffing because we, I, don't know...the volume... the call volume. I don't know what to expect
EVP, Operations
I don't even know why you're here. What we're doing now doesn't need to change.
Head of Architecture
Build me something that shows me when things break and where things break. I don't need fancy shit, I don't want a UI, just give me a window into this system that I don't already have.
Head of Architecture
Repeated testing verified that the "Holy Spreadsheet" problem was the main problem worth solving. But something else important emerged during interviews about the differences between teams.
Operations Executives valued accurate staffing/materials forecasting.
Marketing Executives valued campaign efficacy feedback and regulatory compliance..
IT Executives valued rapid error identification and ease of hotfix deployment.
The Credit Services division in this bank was responsible for helping large companies (American Airlines, Shell, etc) issue their own credit cards. My job was to help the executives of this division make better data-informed decisions by allowing them to interact with the data they were collecting.

The dashboard improved communication across teams by lowering the number of ‘this could have been an email’ update meetings on current data. The Holy Spreadsheet died. Replaced by real-time information on materials, staffing, campaign progress, & more.
Expensive technical errors were easier to identify and solution for the IT department, increasing uptime for applications and preserving some sanity for members in IT maintaining disparate applications.
Viewing and navigating different stores of data through simple data viz components resulted in executives having all the information they needed to make better decisions.
